March 29, 2016

- by Julie Fossitt, Marketing Manager, Cultural Services, City of Kingston
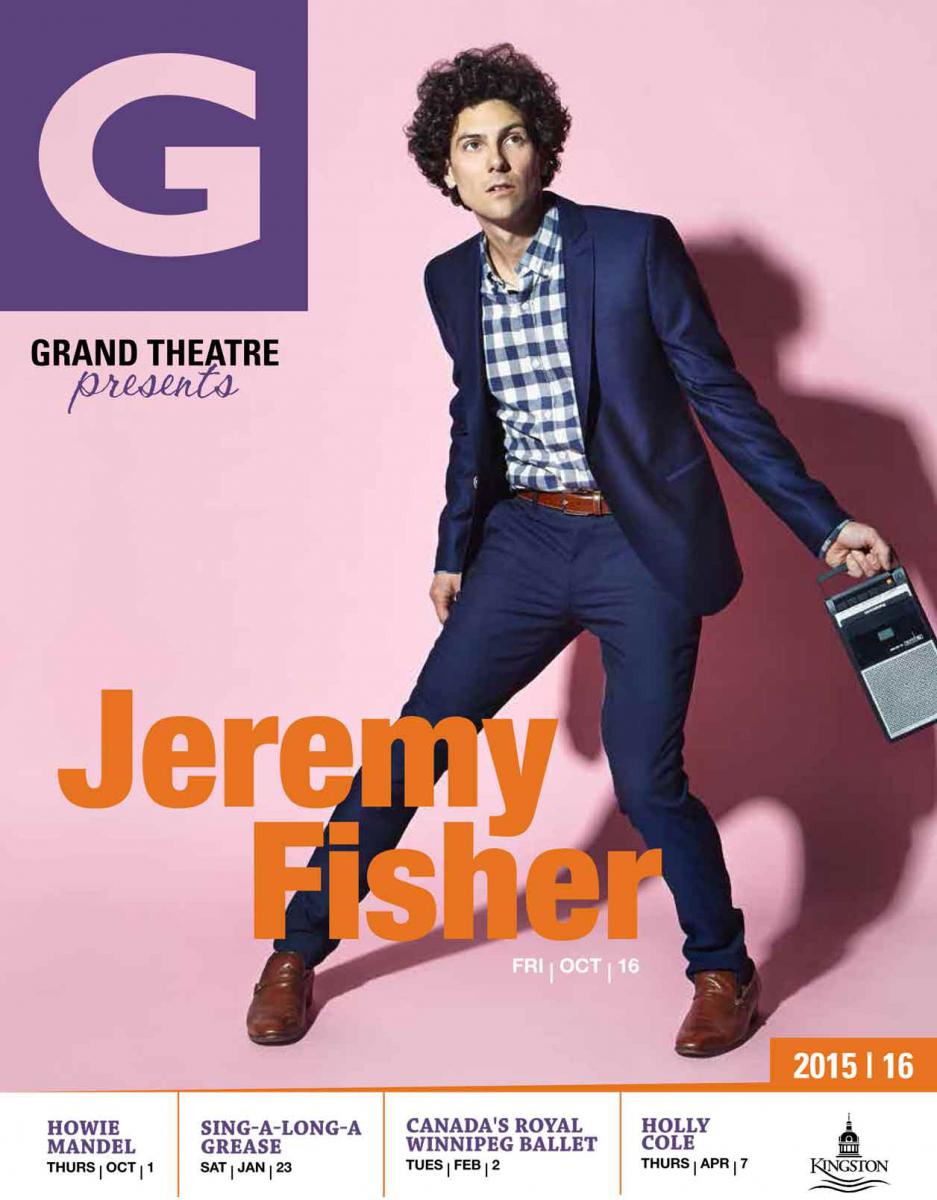
It seems like the only constant item in my arts marketing career has been the annual season brochure. At the start of every calendar year, I would draft my trusty workback schedule and get ready to hound agents, artists, artistic and engagement staff and crack the whip with the graphic designers.
Well, so much has changed in the world of arts marketing, but many arts presenters still print a season brochure to coincide with the launch of the season. I polled a few of my colleagues with these two questions:
“Why do you produce an annual brochure?”
“What would happen if you stopped printing a season brochure?”
The answers were varied and depended on the type of programming, the benefits to subscribing, and the target audience. Also mentioned was the shift to digital marketing and therefore the lack of funds and resources for expensive printing and direct mail.
Check out this great blog post from arts-marketing.blogspot.ca from 2009 that ponders some of these questions.
But let’s take a step back. Why does the season promotion start with the brochure? What if you outlined your subscription objectives and then built out your tactics from there? This is what my colleagues at the Grand Theatre are trying to do this year. So, we have defined our marketing subscription goals as:
- Meet the net subscription revenue goal by the end of the calendar year.
- Achieve fiscal responsibility by providing an advertising budget which is delivered at or under spending limits.
- Work in tandem with the box office coordinator to enable, motivate and empower the team while providing excellent customer service.
- Maintain or exceed the average 46% percent of returning subscribers.
- Survey 2,500 patrons in the 16/17 season to gauge their customer experience with a goal of 70% satisfaction.
- Offer a sales process which is customer friendly and easy to complete.
Now that we have our goals, we have to figure out how to achieve them. This includes going through and listing our audiences and tactics for each goal, and the tools we need to measure success.
For example, we have identified a number of our subscription audiences as existing subscribers, past subscribers, single ticket buyers, and key target audiences using research through Environics and PRIZM clusters (more on that in an upcoming blog post).
Our team determined that one of the tactics for the above audiences is a season brochure that is mailed. The decline of direct mail can actually work in your favour, as people are getting less and less, and are interested to read something that looks exciting. But, in order to track the success of your season brochure, you need some measurement tools in place.
1) Use unique urls
Use a custom web url on different pages throughout your brochure to digitally monitor traffic. You can either have a special domain redirect to your website – something like ‘NewSymphonySeason.ca’ or ‘ForSubscribersOnly.com’ that redirects to a specific page on your website – or shortened urls. I recommend using bit.ly, as you can customize the shortened url so it’s not full of random letters and numbers and hard to remember.
2) Source codes
Source codes can be a number or letter to differentiate your brochures. Keep it simple. This year we will be trying two – one for direct mail and one for other distribution. When your subscriber goes online or goes to the box office, prompt him or her for the code that is usually located on that back cover. That way, you have an easy way to see if your direct mail offered a good return on investment.
3) Exclusive offer
Adding a promo code or bounce-back coupon in your brochure is another way to gauge success. The promo code could be for a contest on your website or for a deep discount. A contest code tends to get a much higher return since there is no financial transaction required.
4) A/B testing
This is not something that we have tried yet, but would like to in the future. Trying two cover images on one brochure and then seeing what one is picked up more often is a great way to make sure your messaging is hitting the right audience. You can track this by simply having both at your theatre and monitoring how many go out, or by asking online or through the box office similar to a source code.
There are some other tips and tricks for “How to Track Offline Marketing Campaigns with Analytics” in this post from Kissmetrics.
As you plan for your season brochure creative brief, check out the “Six notes as you plan your season brochure” blog post from Audience View. This post also includes a nice round-up of some beautiful examples, which is always great for creative inspiration.
We will report back next winter with a report on if and how we met our subscription objectives for the 2016/17 season. Happy brochure season everyone!
About Julie
 Julie Fossitt is the Marketing Manager for Cultural Services at the City of Kingston. The core services for this portfolio include targeted marketing, product development and pricing, partnerships, cultural tourism and the measurement of cultural participation. You can connect with her on Linked In, Twitter or Instagram.